Show: OLLI 2019 Class 5 of 6, Climate Science in the National Climate Assessment[7]
Presented: NC State University
Raleigh, North Carolina, 2019/04/09
Abstract
Abstract data
Description
Description data
Note
Note data
-
Go to last slide Go to next slide

-
Go to previous slide Go to next slide

-
Go to previous slide Go to next slide

-
Go to previous slide Go to next slide

-
Go to previous slide Go to first slide

-
Go to previous slide Go to first slide

-
Go to previous slide Go to first slide

-
Go to previous slide Go to first slide

-
Go to previous slide Go to first slide

-
Go to previous slide Go to first slide

-
Go to previous slide Go to first slide

-
Go to previous slide Go to first slide

-
Go to previous slide Go to first slide

-
Go to previous slide Go to first slide

-
Go to previous slide Go to first slide

-
Go to previous slide Go to first slide

-
Go to previous slide Go to first slide

-
Go to previous slide Go to first slide

-
Go to previous slide Go to first slide

-
Go to previous slide Go to first slide

-
Go to previous slide Go to first slide

-
Go to previous slide Go to first slide

-
Go to previous slide Go to first slide

-
Go to previous slide Go to first slide

-
Go to previous slide Go to first slide

-
Go to previous slide Go to first slide

-
Go to previous slide Go to first slide

-
Go to previous slide Go to first slide

-
Go to previous slide Go to first slide

-
Go to previous slide Go to first slide

-
Go to previous slide Go to first slide

-
Go to previous slide Go to first slide

-
Go to previous slide Go to first slide

-
Go to previous slide Go to first slide

-
Go to previous slide Go to first slide

-
Go to previous slide Go to first slide

-
Go to previous slide Go to first slide

-
Go to previous slide Go to first slide

-
Go to previous slide Go to first slide

-
Go to previous slide Go to first slide

-
Go to previous slide Go to first slide

-
Go to previous slide Go to first slide

-
Go to previous slide Go to first slide

-
Go to previous slide Go to first slide

-
Go to previous slide Go to first slide

-
Go to previous slide Go to first slide

-
Go to previous slide Go to first slide

-
Go to previous slide Go to first slide

-
Go to previous slide Go to first slide

-
Go to previous slide Go to first slide

-
Go to previous slide Go to first slide

-
Go to previous slide Go to first slide

-
Go to previous slide Go to first slide

| 1 |
|
Climate Science in the National Climate Assessment | 2 |
|
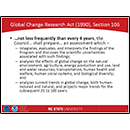
Global Change Research Act (1990), Section 106 |
| 3 |
|
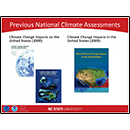
Previous National Climate Assessments | 4 |
|
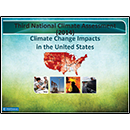
Third National Climate Assessment (2014) |
| 5 |
|
Fourth National Climate Assessment (2017, 2018) | 6 |
|
Fourth National Climate Assessment (2017, 2018) - continued |
| 7 |

|
Previous National Climate Assessments | 8 |
|
Observed Temperature and Related Quantities |
| 9 |
|
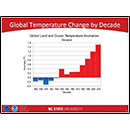
Global Temperature Change by Decade | 10 |
|
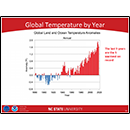
Global Temperature by Year |
| 11 |
|
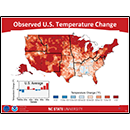
Observed U. S. Temperature Change | 12 |
|
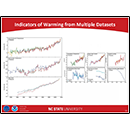
Indicators of Warming from Multiple Datasets |
| 13 |
|
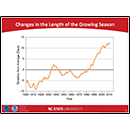
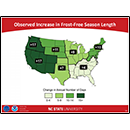
Changes in the Length of the Growing Season | 14 |
|
Observed Increase in Frost-Free Season Length |
| 15 |
|
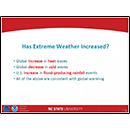
Has Extreme Weather Increased? | 16 |
|
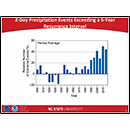
2-Day Precipitation Events Exceeding a 5-Year Recurrence Interval |
| 17 |
|
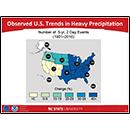
Observed U. S. Trends in Heavy Precipitation | 18 |
|
Heat and Cold Waves |
| 19 |
|
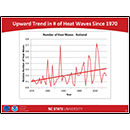
Upward Trend in # of Heat Waves Since 1970 | 20 |
|
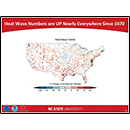
Heat Wave Numbers are UP Nearly Everywhere Since 1970. |
| 21 |
|
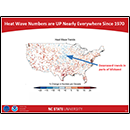
Heat Wave Numbers are UP Nearly Everywhere Since 1970. | 22 |
|
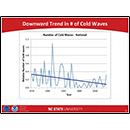
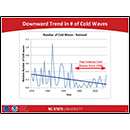
Downward Trend in # of Cold Waves |
| 23 |
|
Downward Trend in # of Cold Waves | 24 |
|
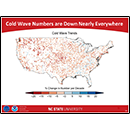
Cold Wave Numbers are Down Nearly Everywhere |
| 25 |
|
Energy Usage for Heating and Cooling | 26 |
|
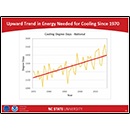
Upward Trend in Energy Needed for Cooling Since 1970 |
| 27 |
|
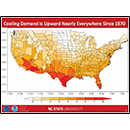
Cooling Demand is Upward Nearly Everywhere Since 1970 | 28 |
|
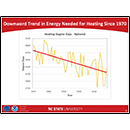
Downward Trend in Energy Needed for Heating Since 1970 |
| 29 |
|
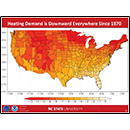
Heating Demand is Downward Everywhere Since 1970 | 30 |
|
Why is the Earth Warming? |
| 31 |
|
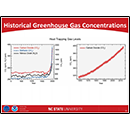
Historical Greenhouse Gas Concentrations | 32 |
|
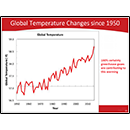
Global Temperature Changes since 1950 |
| 33 |
|
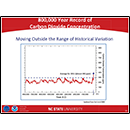
800,000 Year Record of Carbon Dioxide Concentration | 34 |
|
Alternate/Additional warming causes |
| 35 |
|
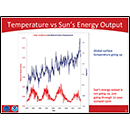
Temperature vs Sun"s Energy Output | 36 |
|
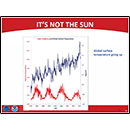
IT"S NOT THE SUN |
| 37 |
|
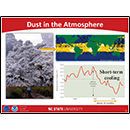
Dust in the Atmosphere | 38 |
|
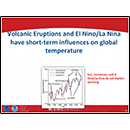
Volcanic Eruptions and El Nino/La Nina have short-term influences on global temperature |
| 39 |
|
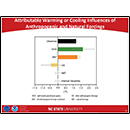
Attributable Warming oe Cooling Influences of Anthropogenic and Natural Forcings | 40 |
|
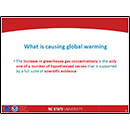
What is causing global warming? |
| 41 |
|
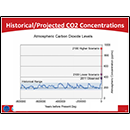
Historical/Projected CO2 Concentrations | 42 |
|
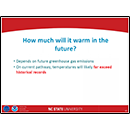
How much will it warm in the future? |
| 43 |
|
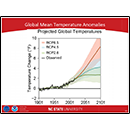
Global Mean Temperature Anomalies | 44 |
|
Changes in Extreme Temperature |
| 45 |
|
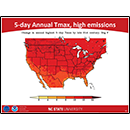
5-day Annual Tmax, high emissions | 46 |
|
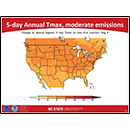
5-day Annual Tmax, moderate emissions |
| 47 |
|
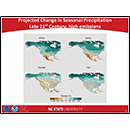
Projected Change in Seasonal Precipitation late 21st Century, high emissions | 48 |
|
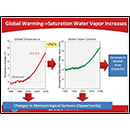
Global Warming→Saturation Water Vapor Increases |
| 49 |
|
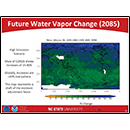
Future Water Vapor Change (2085) | 50 |
|
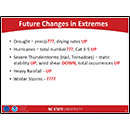
Future Changes in Extremes |
| 51 |
|
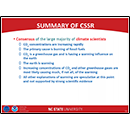
SUMMARY OF CSSR | 52 |
|
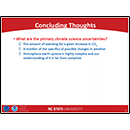
Concluding Thoughts |
| 53 |
|
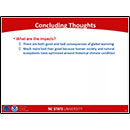
Concluding Thoughts - continued |